Field note · December 18, 2025
What Features Have the Greatest Impact on Revenue?
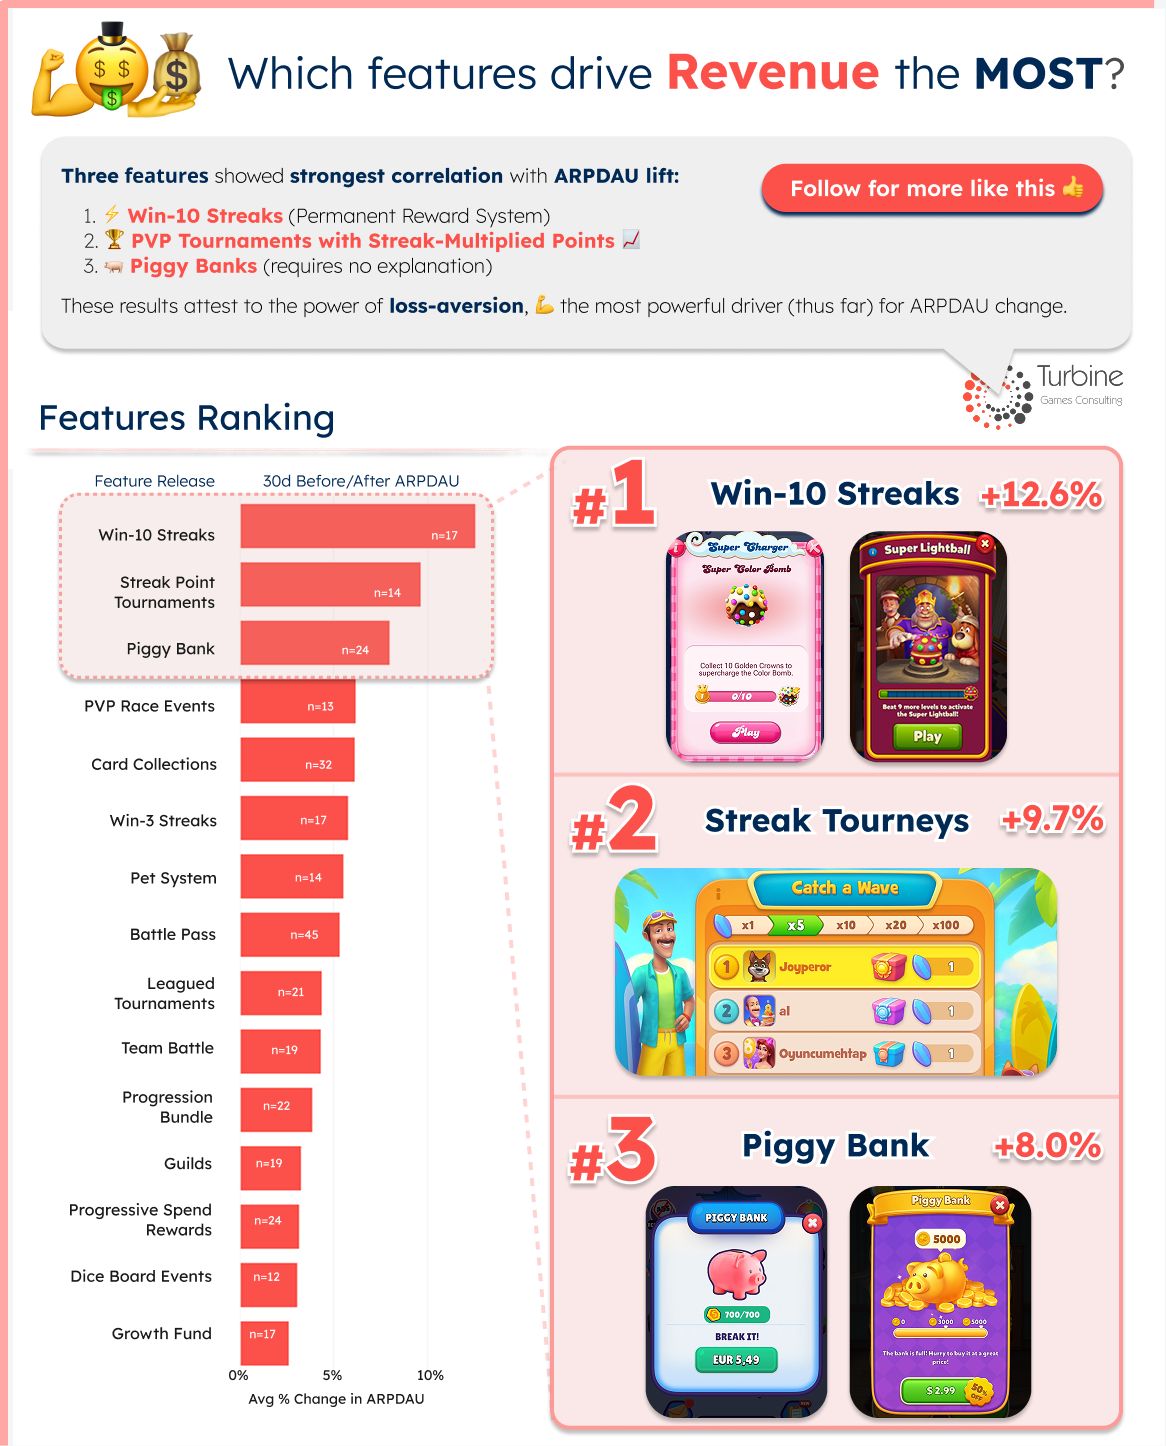
What features have the greatest impact on Revenue?
Turbine analyzed how feature launches correlated with ARPDAU in successful casual games —
What the data suggests
3 features most strongly correlated with ARPDAU lift:
- 10-Win Streaks: Permanent Reward System
- PVP Tournaments with Streak-Multiplied Points
- Piggy Bank (requires no explanation)
- These results attest to the power of loss-aversion.
- Turbine's own loss-aversion experiments agree
What features had the weakest correlation?
- Growth Fund (non-repeatable, some cannibalization)
- VIP Systems (Too slow, passive, cannibalizing?)
- Dice Board Events (Low monetization pressure?)
What was the biggest surprise?
- Progression Bundles - weak (4.3%) avg. lift.
Given their ubiquity, I had expected this to land top-five. Perhaps these offers don't get enough uptime to have significant impact in first month of release. They are usually run as limited-time sales. Later, they are stacked and reused for more uptime & impact, but likely not in first 30 days.
Another surprise?
- Card Album Collections - middling (6%) avg. lift.
The gold standard implementation in casual games is a big spend depth feature, and an XXL development task. Like Progression Bundles, I'd expect such a ubiquitous (and expensive) feature to work harder!
My takeaways
For games that already have proven product–market fit
- MOST 'big' monetization features move ARPDAU 3-5%
- A 'big win' looks like 8-15% lift*
- No clear correlation b/t feature scope and impact.
- Loss-aversion is the most powerful 'hack' we've identified (thus far) for driving ARPDAU behavior.
* Takeaways are informed by this analysis, plus hundreds of a/b tests Turbine has done targeting ARPDAU.
Caveats
- This is a noisy dataset & correlation is not causation.
- ARPDAU data are ST estimates, not actuals.
- Given above, I'd interpret results conservatively, i.e. 'these 3 features are probably more likely than others in the list to move ARPDAU'
- Turbine's extensive a/b testing does support these recos, but we haven't shared that data here
Methodology
- Feature launch dates cobbled from multiple sources
- Manually reviewed implementations for quality
- ARPDAU data (estimates, per geo) from Sensortower
- Looked at ARPDAU 30d before v 30d after 1st launch
- Slightly mitigated noise by analyzing per country across Geos that should be uncorrelated re: featuring
- Tried for at least 12 casual games per feature.
Turbine helps mobile game & app publishers drive UA and product KPIs.
Book Intro Call View original on LinkedIn →